top of page
Stationary

STATGR 5702

My Work Showcase

Learn More
Course Slides: Welcome

Projects

Showcase of Work

Introduction to Exploratory Data Analysis and Visualization

Exploration vs. Visualization (Presentation) Sometimes called "exploratory" vs. "explanatory" Not mutually exclusive Visualizations that offer insight are likely to be shared Still, focus is different when exploratory a dataset for the first time vs. presenting to an audience, particularly a less technical one.

屏幕快照 2020-11-04 上午10.49.09.png
屏幕快照 2020-11-04 上午10.45.11.png

 Web scraping 

Web scraping is a last resort Better to find an API, use httr package Even better, find an R package ex. https://cran.rproject.org/web/packages/atus/index.html

Histogram

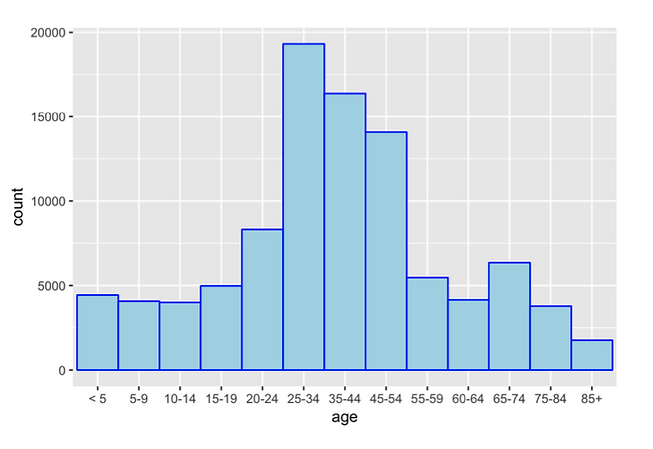
A histogram is a graphical display of data using bars of different heights. In a histogram, each bar groups numbers into ranges. Taller bars show that more data falls in that range. A histogram displays the shape and spread of continuous sample data.

屏幕快照 2020-11-04 上午10.47.38.png
Course Slides: Projects
bottom of page